Situation
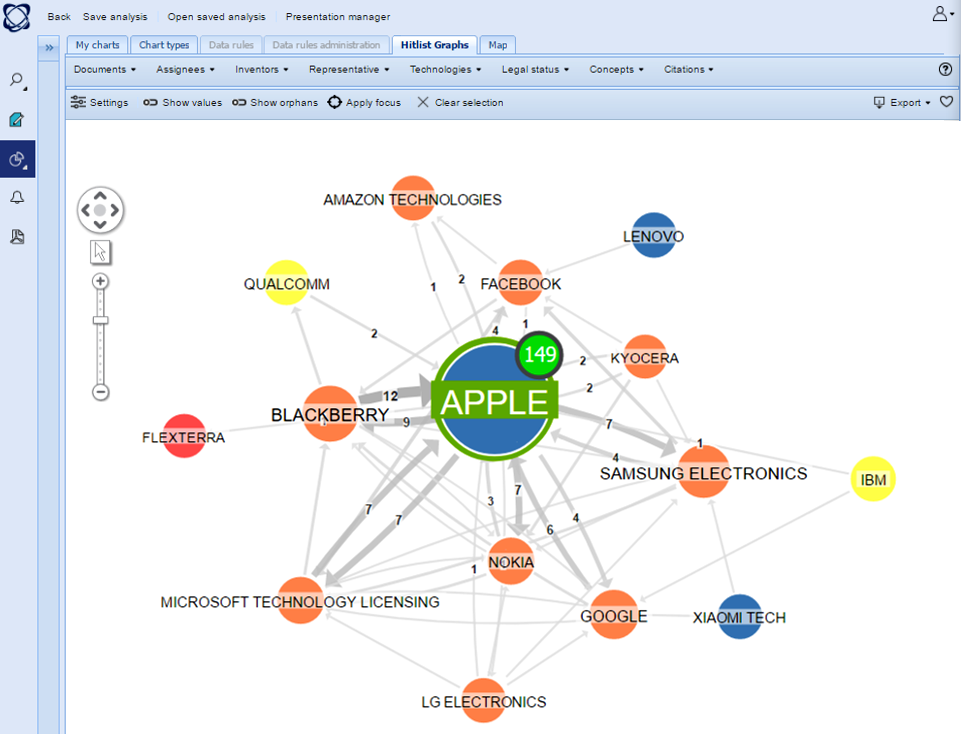
Questel's Orbit is a web based patent analysis software integrating a powerful search module and a suite of patent analysis algorithms and visualization tools.
Their existing dataViz module was bitmap based, and therefore is CPU consuming and costly in maintenance. They wanted to migrate their graphs to an upper-level library that is easy to use for developers, cross-browser compatible, lightweight and fast.
Challenges
The challenge when totally replacing an existing solution is to make a significant leap forward without feature-loss or regressions...
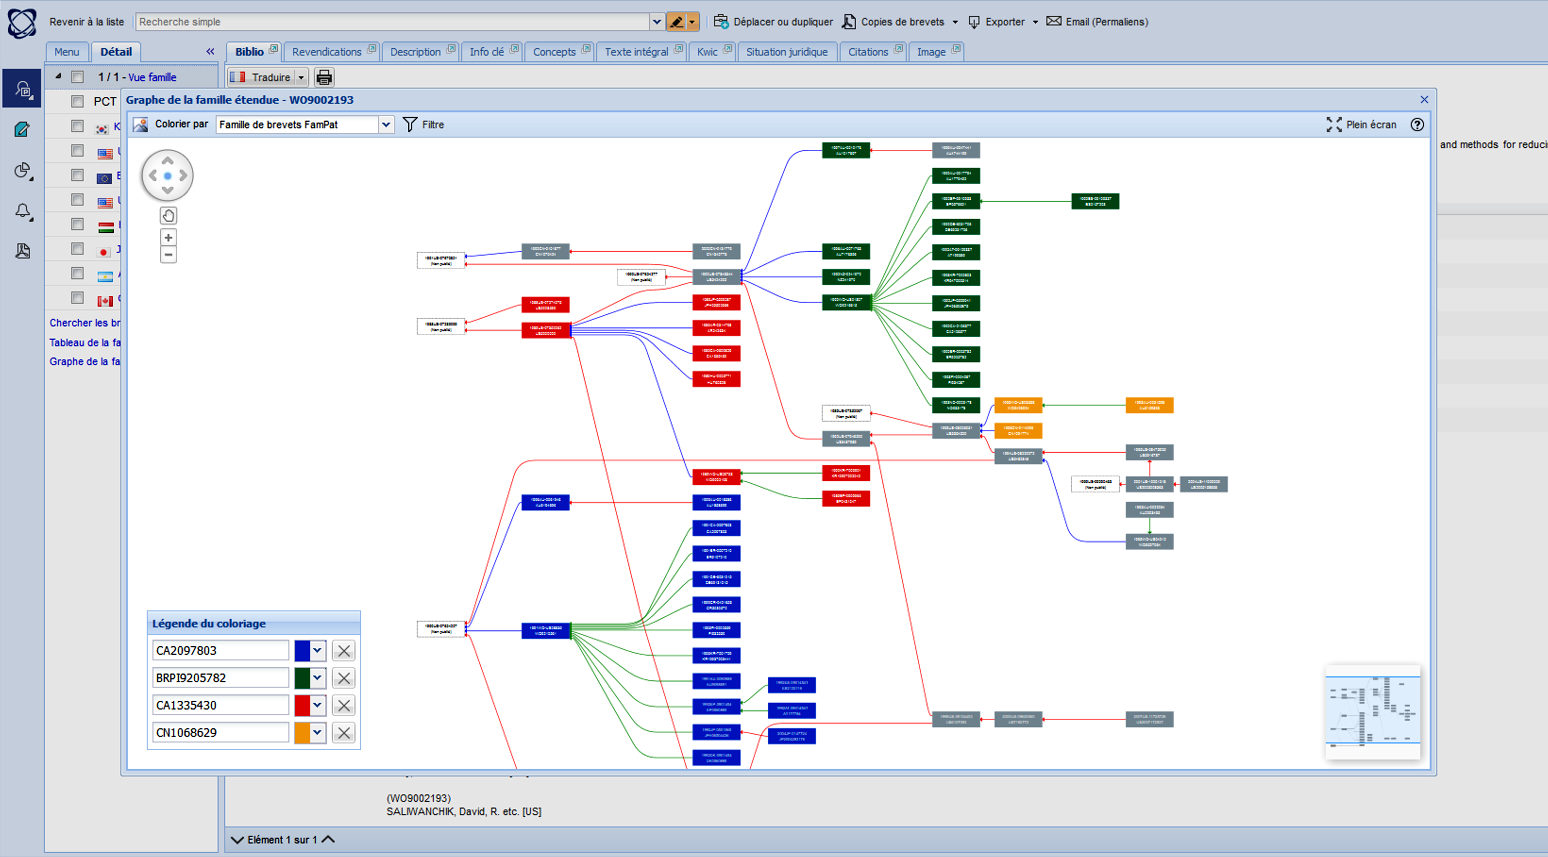
Also, the library have to display data from any kind of data source, easily enable interactive creation, viewing and editing. Automatic diagram layout and analysis algorithms should help users understand even the most complex graph structures.
Solution
-
Graph analysis
-
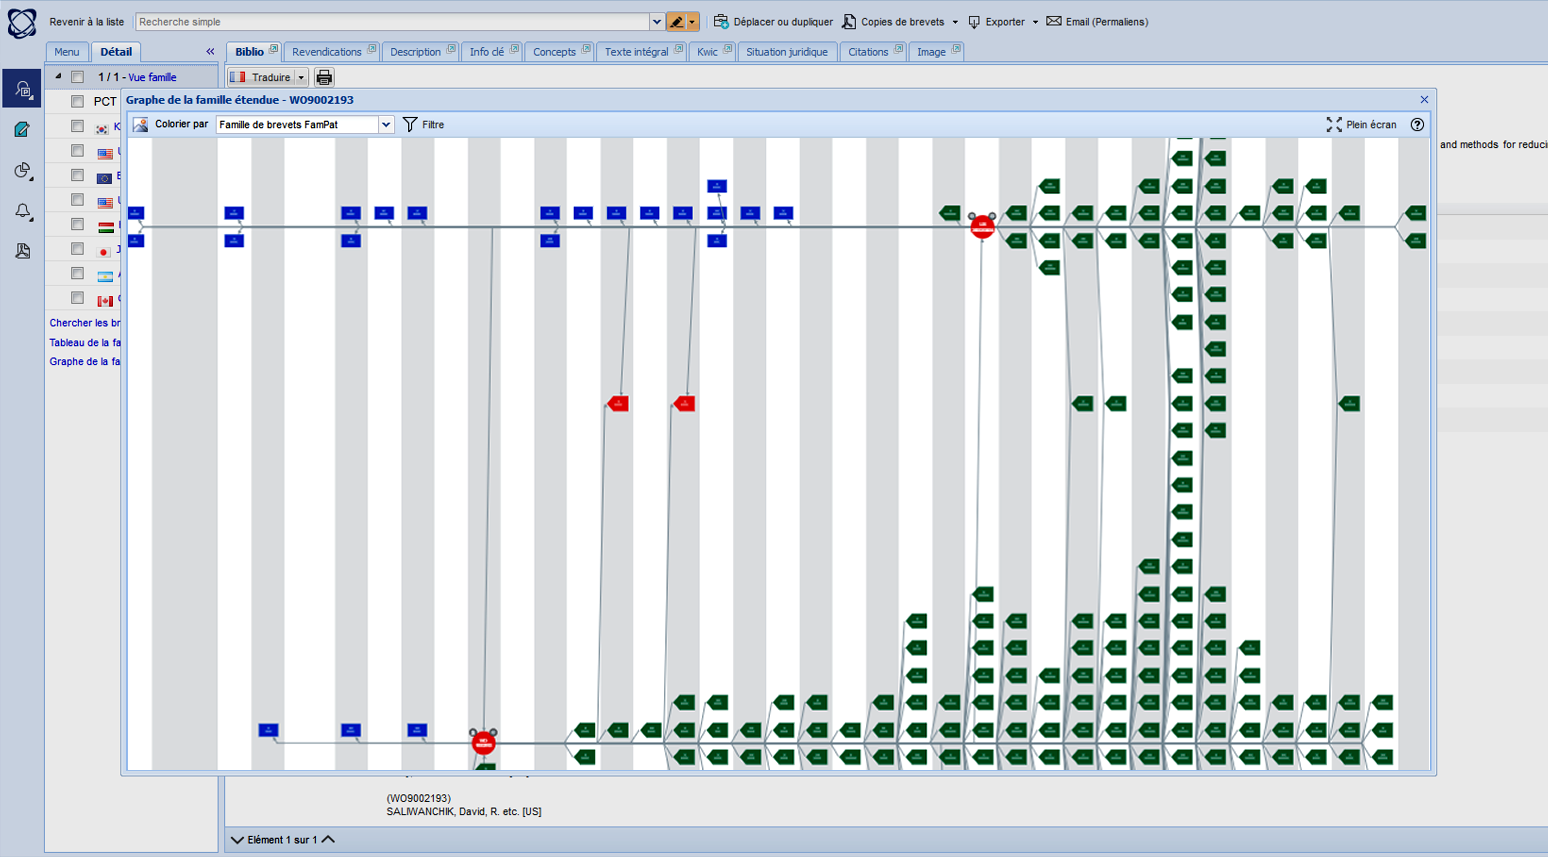
Automatic diagram layout
-
Good level-of-details visualization
-
Rich APIs for extensive customization
-
Data Binding
-
Full Support for Keyboard, Mouse, and Touch
-
Edge Routing Algorithms
-
Layout features like easy adjustment,animated changes, edge-grouping, tables and Swimlanes
-
Efficient Graph Analysis Algorithms
There are also a number of analysis algorithms to determine common structural traits (such as connectivity, cycles, whether a graph is a tree), pathfinding and reachability, clustering and centrality measures, graph traversals and more.
As a result, the operating and maintenance budget decreased from +50K$/year to a few K$.
Customers saw a significant improvement in term of speed and accessibility.